
How Dashboards Help Businesses Make Better Decisions
Dashboards turn scattered business information into clear views that help teams track performance, operations, and priorities.
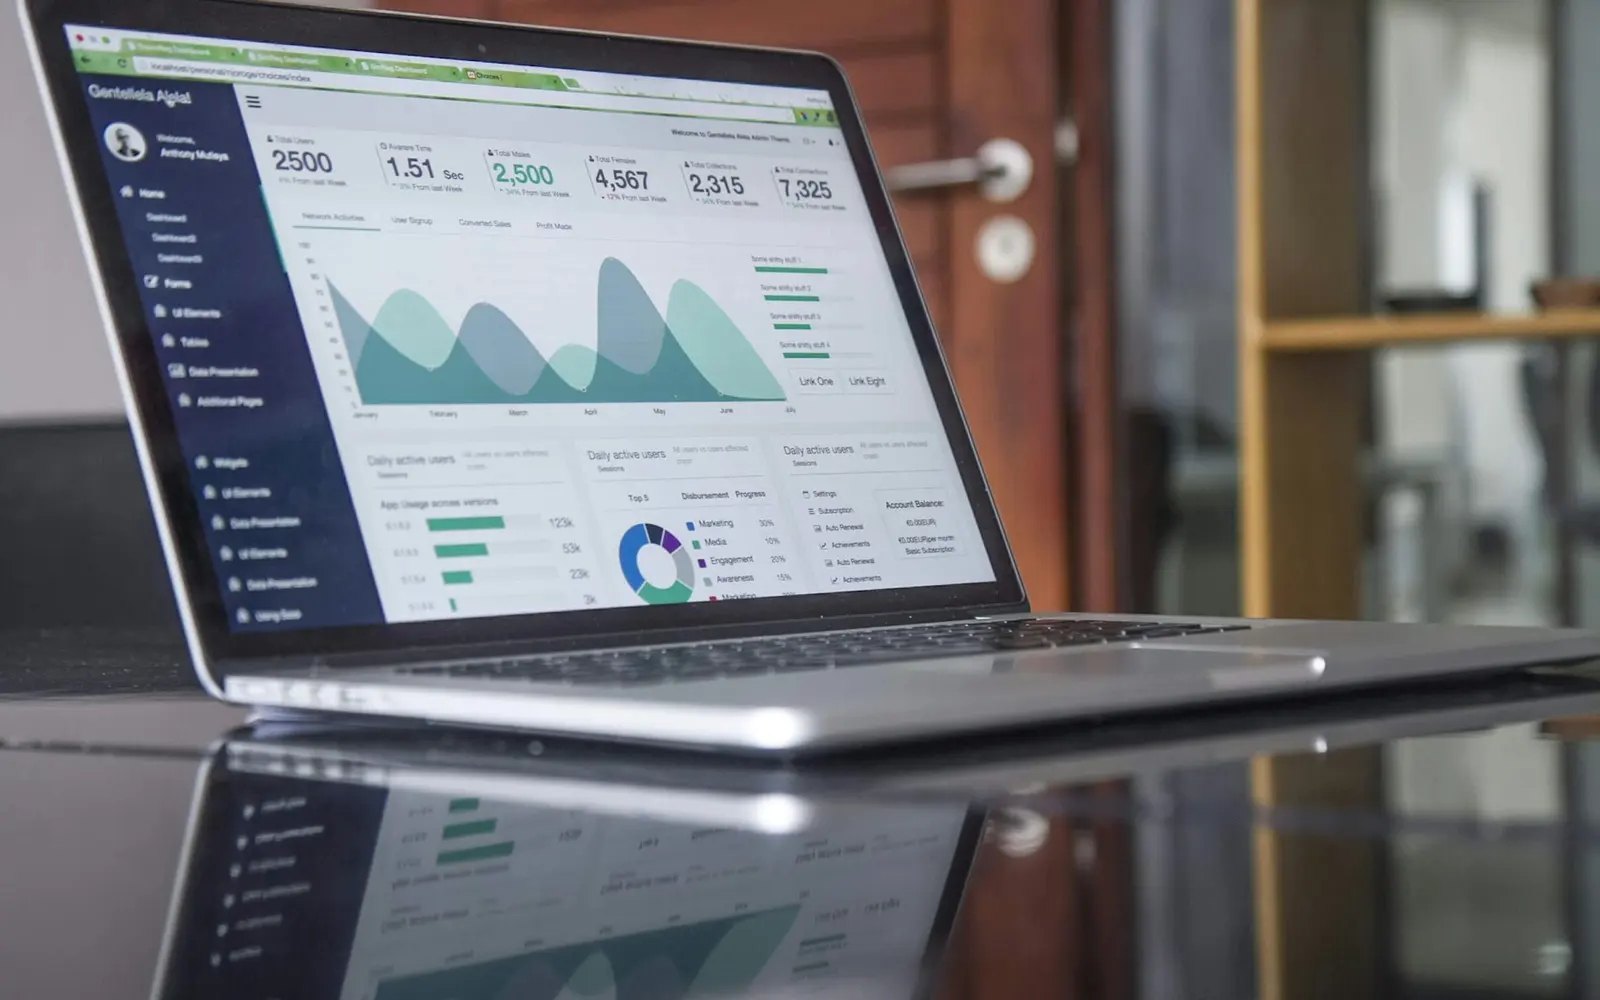
Businesses often have useful information spread across spreadsheets, messages, forms, invoices, analytics tools, and team notes. Dashboards help by collecting the most important signals in one place.
Dashboards create visibility
A good dashboard shows what is happening now. Sales, requests, inventory, project status, customer activity, and team workload become easier to scan.
Better decisions need better context
Leaders make stronger decisions when data is organized around business questions, not scattered across separate tools.
Dashboards reduce manual reporting
Instead of building the same report every week, teams can use live or semi-automated dashboards to keep key information updated.
Design matters
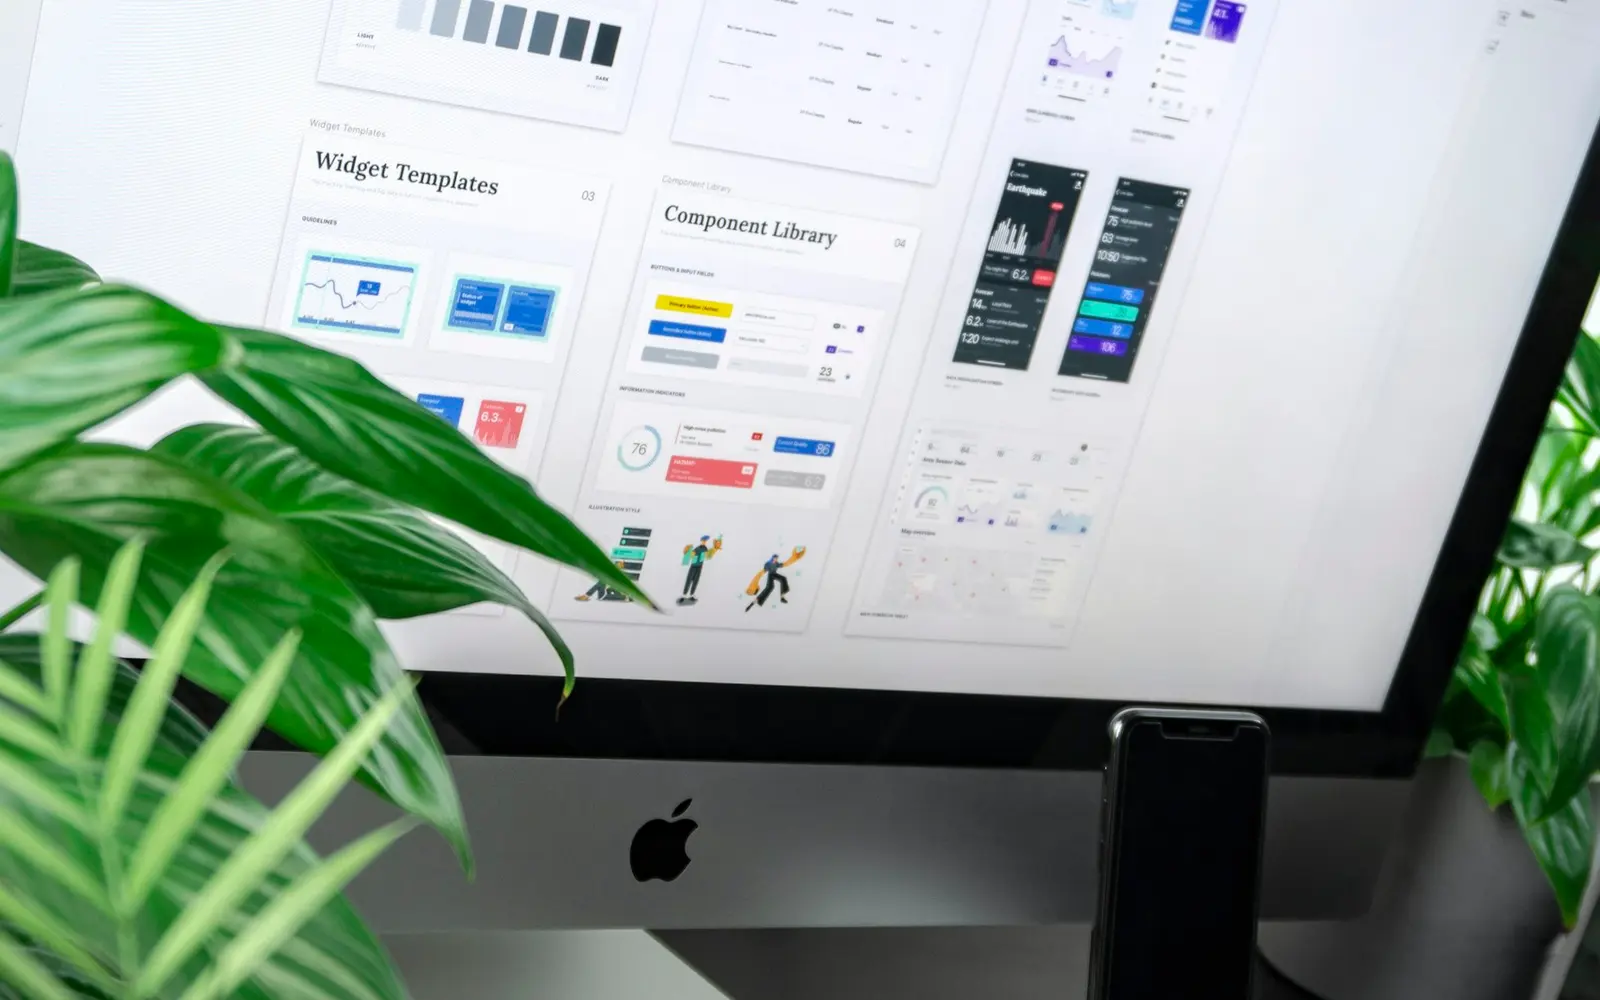
The dashboard should not overwhelm users. Clear hierarchy, filters, charts, tables, and status indicators make the data easier to act on.
The takeaway
Dashboards help teams move from guessing to seeing.
Summarize it, simplify it, or connect it to a Curved Solution service.


Let's build
Tell us what you are building. We will come back with how we would approach it, what it takes, and what it costs — no template decks.
